

Dashboard: reading your analytics
The Dashboard is your analytics home page — the first thing you see after signing in to Admin. It gives you a complete picture of how your church community is engaging with your app, across growth, daily habits, prayer, media, and content.
How it works
To open the Dashboard, sign in to Admin and select the Dashboard (odometer) icon at the top left.
The Dashboard pulls together engagement from every Apollos surface — your mobile app, TV apps, and website embeds. Each panel loads independently, so a slow chart never blocks the rest of the page.
The full analytics dashboard is included on higher plans. Churches on other plans see a welcome screen describing the available platforms instead of charts — talk to your Apollos contact if you'd like to upgrade.
If your app runs without member sign-in, or is configured as a kids app, you'll see a "limited analytics" notice — most engagement tracking is tied to signed-in members, so the numbers will be incomplete.
Filter by time
Every chart respects a shared time range picker at the top of the page. Changing it refreshes all charts at once:
| Button | Range | Charts break down by |
|---|---|---|
| 7D | Last 7 days | Day |
| 30D | Last 30 days | Day |
| 3M | Last 3 months | Week |
| 6M | Last 6 months | Month |
| 1Y | Last year | Month |
The Dashboard opens on 30D. Beside the buttons, a line of text confirms what you're looking at — "Showing the last 30 days of activity".
Read the Growth panels
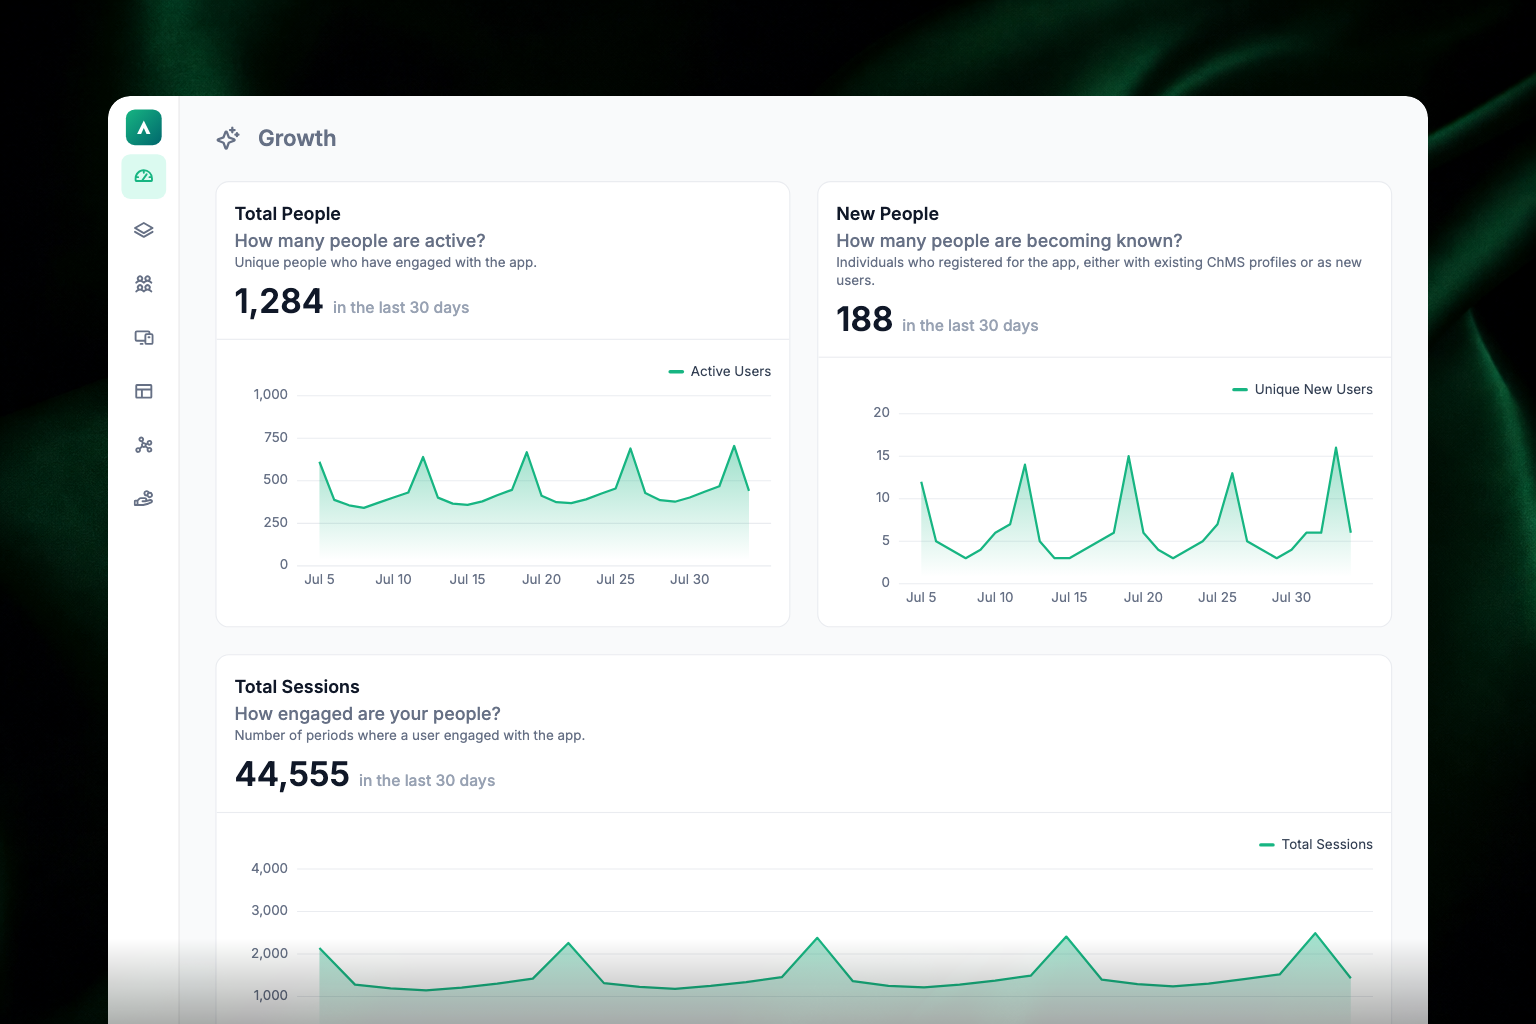
The three panels at the top of the page track how your app community is growing:
- Total People — how many unique members were active in the app during the selected period. The headline number is the total for the period; the chart beneath it breaks the period down by day, week, or month. Hover over the chart to see exact numbers.
- New People — how many people used the app for the first time, whether they already had a profile in your ChMS or are brand new.
- Total Sessions — how many times members opened and engaged with the app. One member can have several sessions in a day, so this is always higher than Total People.
Read the Daily Habits panels
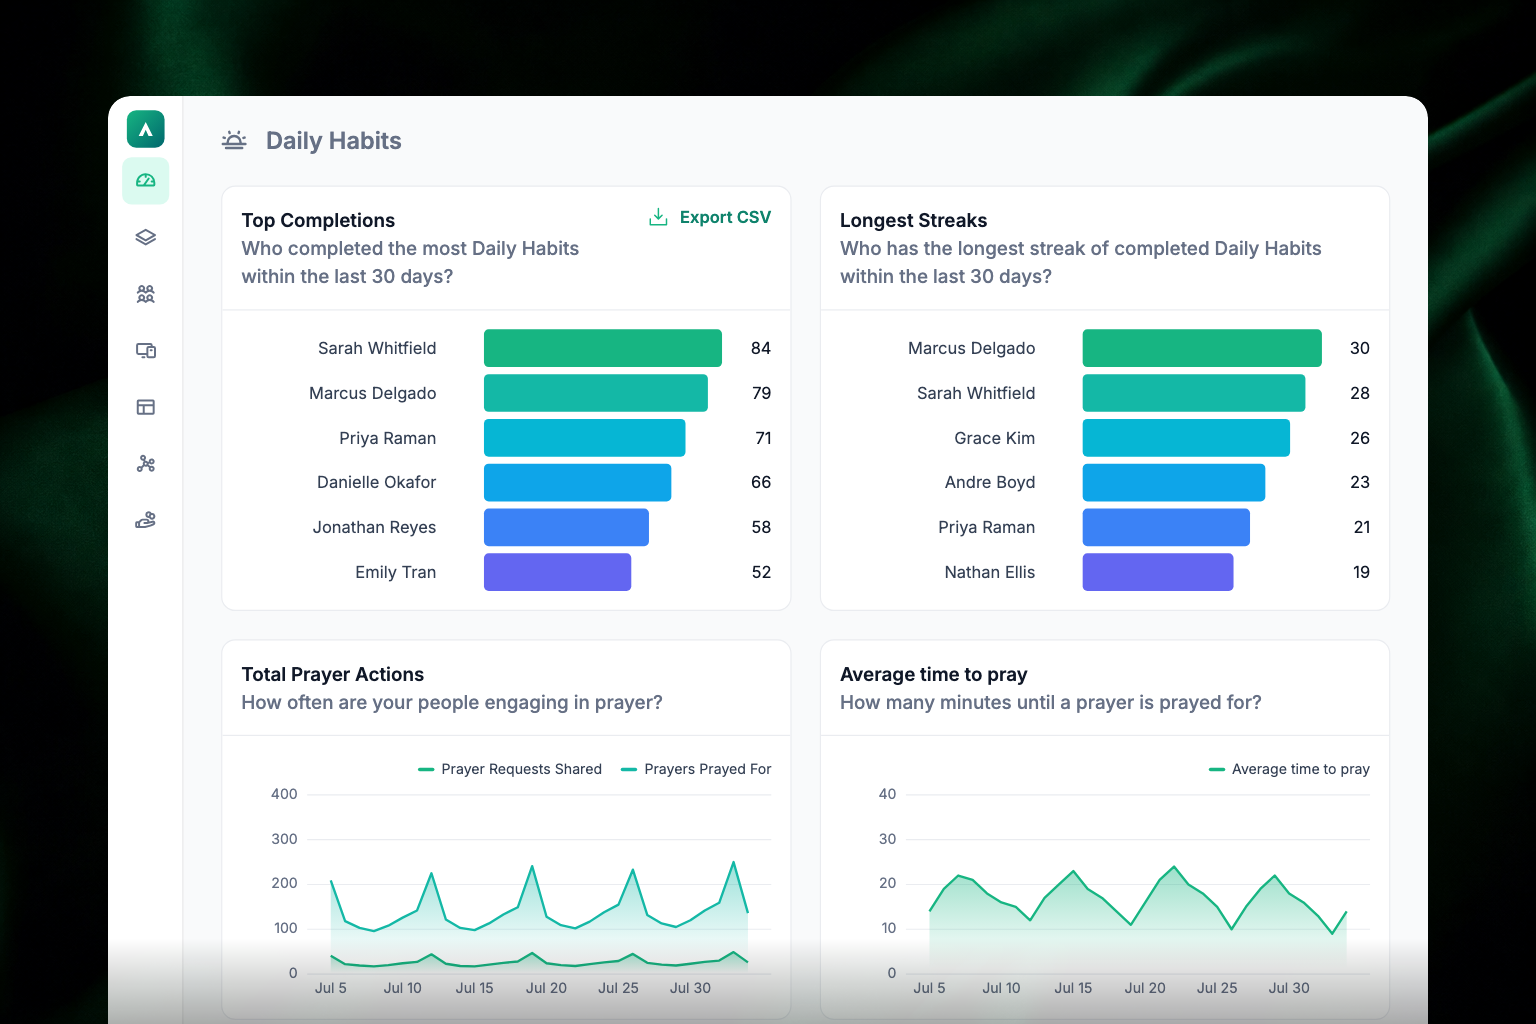
These panels track engagement with daily habits (devotionals, readings) and prayer:
- Top Completions — the members who completed the most daily habits during the period. Click a name to open their profile in Audience. You can export this list to CSV using the button in the top right corner of the panel.
- Longest Streaks — the members with the longest unbroken runs of daily habit completions. Click a name to open their profile.
- Total Prayer Actions — how many prayer requests members shared and how many prayers were prayed for others, with totals at the top and a stacked chart below showing both together.
- Average time to pray — on average, how many minutes pass between a prayer request being shared and someone praying for it. A great measure of how responsive your community is.
Read the Tap Tags panels
If your church uses Apollos Tap, an extra section shows how your physical tags are performing:
- Total Engagement — total tag scans over time (NFC taps and QR scans combined).
- Popular Tap Tags — which individual tags get scanned the most.
- Campus Performance — scans broken down by campus, so you can see which locations get the most engagement.
- NFC vs QR Code — how many people tapped their phone versus scanned the QR code.
- Top Tap Content — what people actually opened and did after tapping a tag.
If you use Tap and don't see this section, ask your Apollos contact to enable Tap analytics for your church.
Read the Media panel
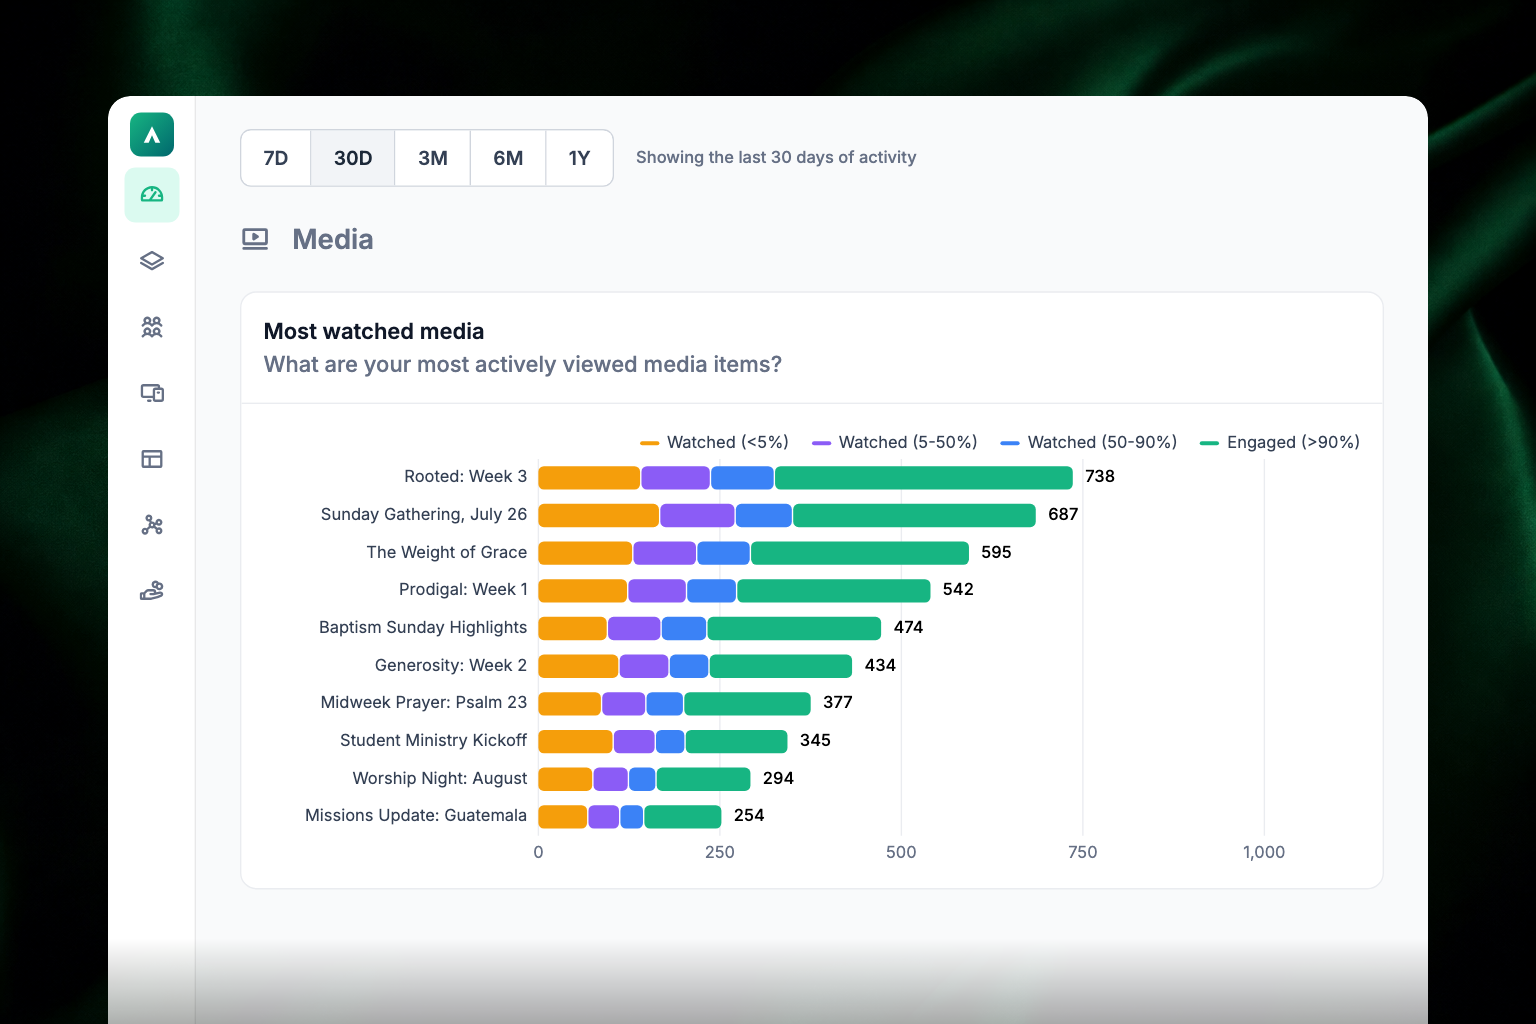
Most watched media shows your top videos by views — across the mobile app, TV apps, and website embeds. Each video gets a horizontal bar, split into four colored segments by how much of the video people watched, with the row's total printed at the end of the bar:
| Segment | Color | Meaning |
|---|---|---|
| Watched (<5%) | Amber | Bounced almost immediately |
| Watched (5-50%) | Violet | Left partway through |
| Watched (50-90%) | Blue | Watched most of it |
| Engaged (>90%) | Apollos green | Watched it through |
Read the Content panel
Popular Content shows your most-opened content items. The chart at the top tracks the top items over time — hover to see exact counts for a specific period. The table below lists each item with its total opens and a per-period breakdown. Click any item to jump to its content page in Admin.
Export data
The Top Completions panel has a CSV export button in its top right corner. Click it to download the leaderboard for the selected time period — useful for following up with your most engaged members.
Troubleshooting
Why are my charts empty?
If your app launched recently, there may not be enough activity yet. If charts are empty for an established app, contact Apollos support.
Why are a few recent days missing from a chart?
Analytics data can take up to 24 hours to fully arrive. Missing recent days usually fill in on their own within a day.
Why do I see a "limited analytics" notice?
Your app is configured to run without member sign-in, or as a kids app. Most engagement tracking depends on knowing who's using the app, so analytics in these configurations are incomplete. This is expected behavior.
Why don't I see the Tap Tags section?
Tap analytics are enabled per church. If you use Apollos Tap and don't see the section, ask your Apollos contact to turn it on.
Why do I see a welcome screen instead of charts?
The full analytics dashboard is included on higher plans. Talk to your Apollos contact about upgrading.